USD/CNH Price Analysis: Recovery remains elusive below 6.7300
- USD/CNH renews intraday high as it bounces off two-week low, snaps three-day downtrend.
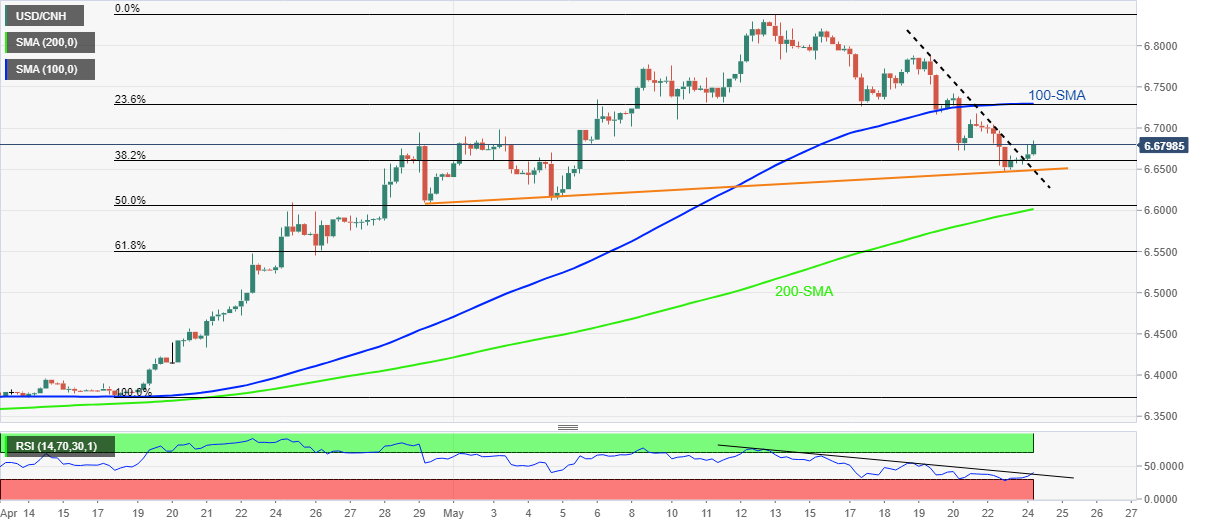
- 100-SMA, 23.6% Fibonacci retracement of April-May advances challenge corrective pullback.
- RSI hints at a further upside, monthly support line restricts short-term declines.
USD/CNH takes the bids to renew intraday high around 6.6850 heading into Tuesday’s European session.
In doing so, the offshore Chinese yuan (CNH) pair bounces off an upward sloping trend line from April 29 to print the first daily gains in four. The recovery moves also take clues from the recently firmer RSI from oversold territory, as well as from the RSI breakout of a fortnight-old descending trend line.
However, a convergence of the 100-SMA and 23.6% Fibonacci retracement of the USD/CNH up-moves from April 18 to May 13, near 6.7300, appears a tough nut to crack for the bulls.
Following that, a run-up towards the monthly high surrounding 6.8400 can’t be ruled out.
On the flip side, the weekly descending trend line and an upward sloping support line restrict the short-term downside of the USD/CNH pair to around 6.6500.
Following that, the 200-SMA near 6.6000 appears the last defense for the USD/CNH bulls.
USD/CNH: Four-hour chart
Trend: Further upside expected