Gold Price Forecast: XAU/USD remains locked in range around $1,925, awaits fresh impetus – Confluence Detector
- Gold price wavers within a familiar trading band around $1,925.
- US dollar cheers hawkish Fed, risk-aversion. Falling yields cap gold’s downside.
- Gold Price Forecast: Defending $1,915 is critical for XAU/USD after hawkish Fed minutes.
Gold price remains driven by the Fed sentiment, especially after the hawkish FOMC minutes pointed to aggressive tightening this year. The US dollar resumes its previous uptrend, in light of the Fed’s tightening expectations, which fuelled risk-off trading in global stocks. Meanwhile, escalating Russia-Ukraine conflict, with the West punishing Russia with more sanctions, help provide a floor under gold price. Gold traders await clarity on the Ukraine crisis for a fresh direction. In the meantime, the yields’ price action could play a pivotal role in influencing gold price.
Read: Aggressive Fed shocks stocks
Gold Price: Key levels to watch
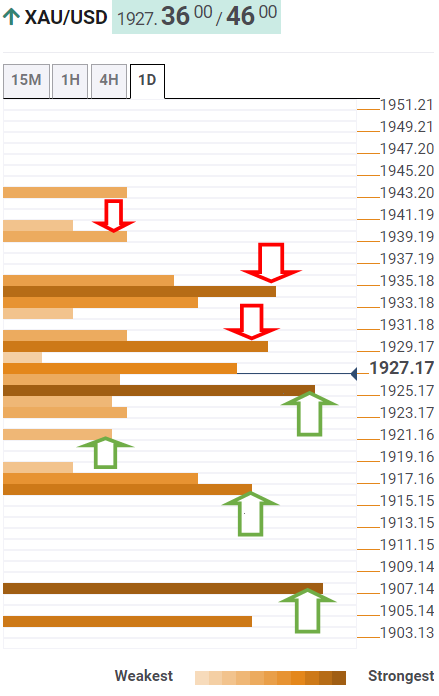
The Technical Confluences Detector shows that gold price is struggling in a tight range, lacking a clear directional bias, as of now.
The immediate upside barrier is seen at $1,930, which is the convergence of the SMA5 one-day and Fibonacci 23.6% one-day.
Gold bulls will then gear up to take out strong resistance around $1,934, where the previous day’s high coincides with the SMA10 one-day and the Fibonacci 61.8% one-week.
Further up, the SMA200 four-hour at $1,939 could give a hard time to gold buyers.
On the flip side, daily closing below $1,925 is needed to yield a sustained move lower. That level is the confluence of the SMA10 four-hour and Fibonacci 61.8% one-day.
A breach of the latter will expose the $1,920 round level.
The next critical cushion is envisioned at $1,916 aligns at $1,925, the intersection of the previous day’s low, pivot point one-day S1 and the Fibonacci 38.2% one-week.
The line in the sand for gold optimists is the powerful cap at $1,907. At that level, the pivot point one-day S2 and Fibonacci 23.6% one-week merge.
Here is how it looks on the tool
About Technical Confluences Detector
The TCD (Technical Confluences Detector) is a tool to locate and point out those price levels where there is a congestion of indicators, moving averages, Fibonacci levels, Pivot Points, etc. If you are a short-term trader, you will find entry points for counter-trend strategies and hunt a few points at a time. If you are a medium-to-long-term trader, this tool will allow you to know in advance the price levels where a medium-to-long-term trend may stop and rest, where to unwind positions, or where to increase your position size.