US Dollar Index Price Analysis: Weekly rising wedge keeps DXY bears hopeful near 95.50
- DXY fades corrective pullback from three-week low, consolidates biggest daily gains in a fortnight.
- Bearish chart pattern, steady RSI favor sellers to aim for further downside.
- 61.8% Fibonacci retracement, 200-SMA adds to the upside filters.
US Dollar Index (DXY) refreshes intraday low around 95.60 while paring the previous day’s gains inside a rising wedge bearish chart pattern amid Wednesday’s Asian session.
That said, steady RSI and sustained trading below the 200-SMA also keep DXY bears hopeful.
However, a clear downside break of the stated wedge’s support line, near 95.55 at the latest, becomes necessary for the sellers to tighten grips.
Following that, the previous resistance line from late January, near 95.20, may offer an intermediate halt during the fall targeting the last month’s bottom surrounding 94.60.
Meanwhile, the corrective pullback may initially attack 61.8% Fibonacci retracement of January’s upside near 95.70 before challenging the wedge’s resistance line near 95.80.
Also challenging short-term DXY upside is the 200-SMA level of 95.91, a break of which will recall bulls targeting a horizontal area from January 25, near 96.25.
DXY: Four-hour chart
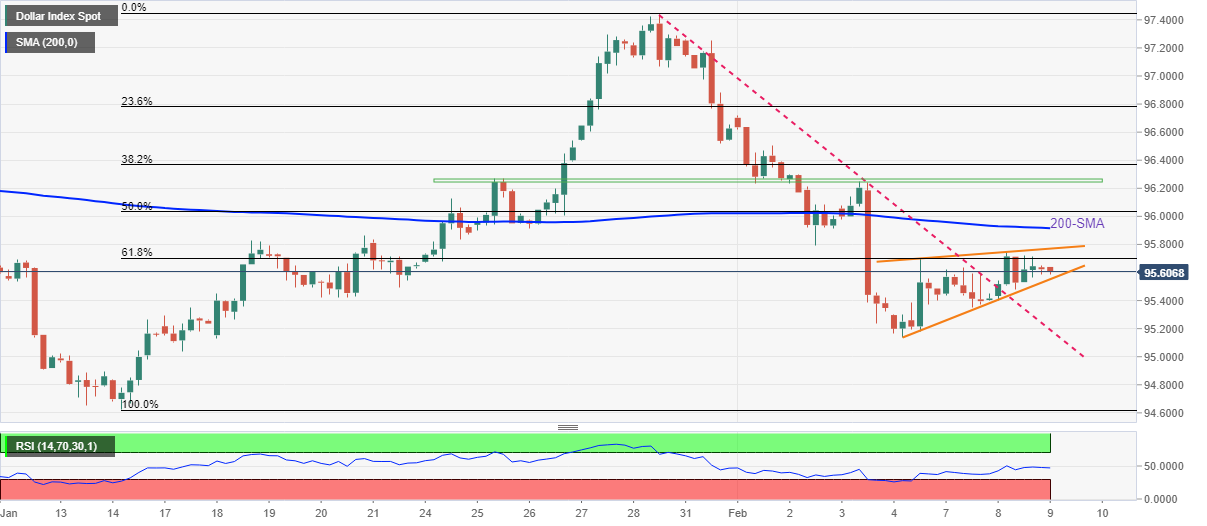
Trend: Further weakness expected