USD/JPY Price Analysis: Bulls are engaging and eye a break of 115 the figure
- USD/JPY is holding at critical daily chart support.
- The focus is on clearing through low volumes around 115 the figure.
The daily chart contains a complex market structure which the following illustration breaks down and arrives at a bullish conclusion.
Firstly, the old downtrend was broken on Jan. 26 and lower high of the 18th on Jan. 27. This price action left a W-formation on the charts. The price, as it typically does, moved back to retest the neckline of the W-formation on Feb.2's low in a correction.
USD/JPY daily chart
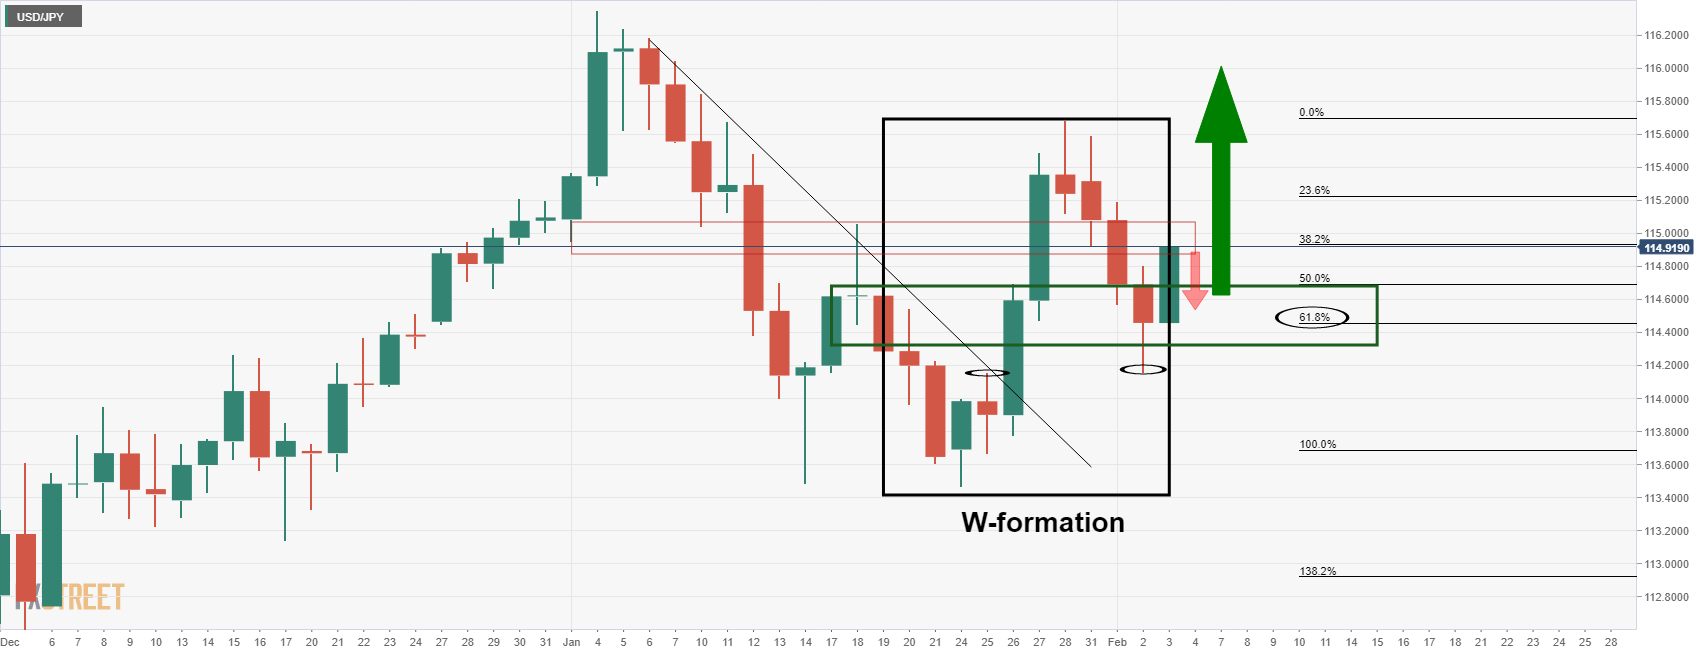
Since then, the price has stabilised around a 61.8% Fibonacci of the prior bullish breakout of the downtrend ad has started to move in on a historically low volume area near 115 the figure. There could be some selling pressure to hold off initial tests here, but if bulls commit to USD/JPY above 114.50, then, the price would be expected to be attracted towards 115.50 on a break of 115 the figure.
USD/JPY H4 chart
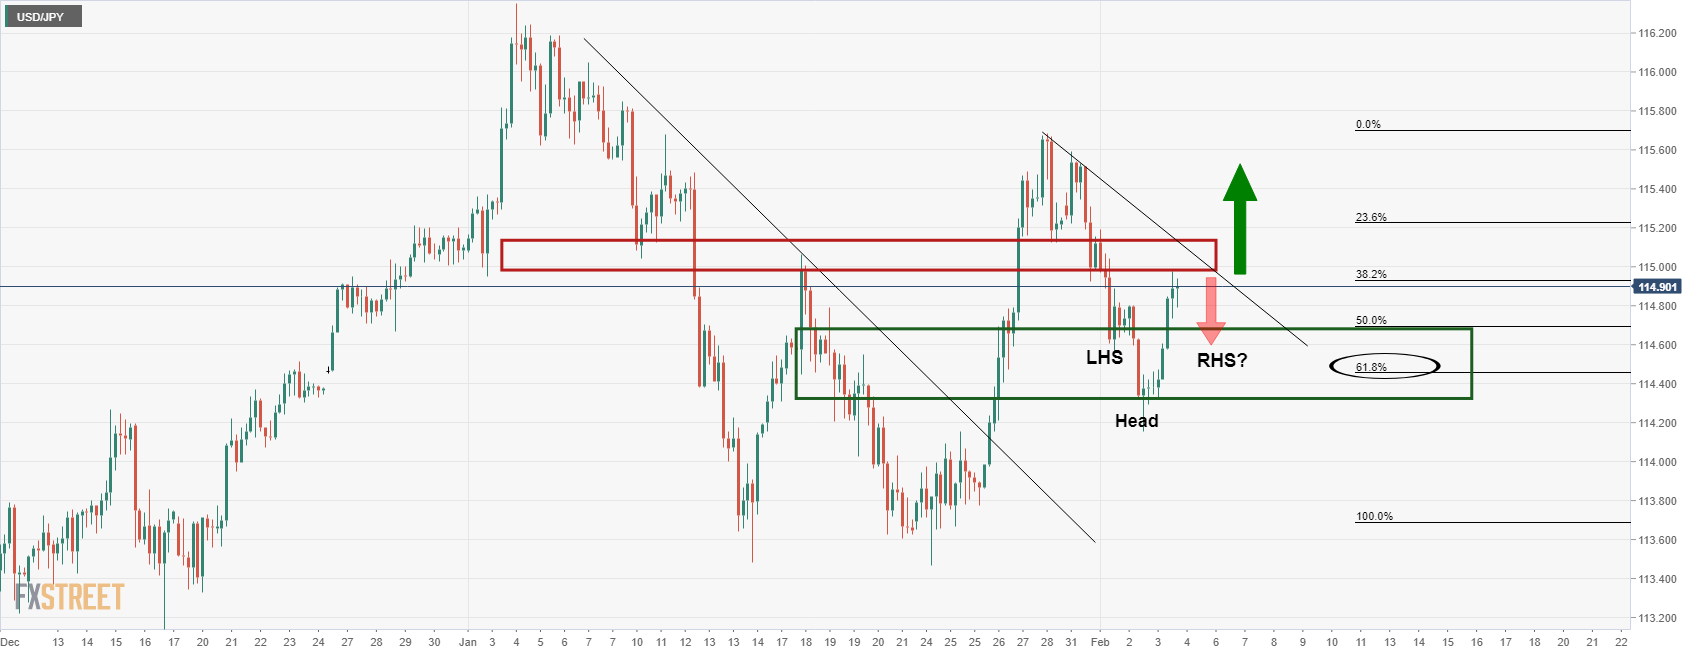
The lower time frames, such as the H4 chart can offer some deeper insight into the market structure and levels of importance. As illustrated, there are prospects of an inverse head ad shoulders forming from which the price would be expected to extend higher beyond 115.00 following a restest of support.