Silver Price Forecast: XAG/USD recovers from three straight-day losses target $23.00
- XAG/USD reached a new-year low at $22.03.
- The daily chart depicts a downtrend, but a double-bottom pattern cap further losses.
- Failure to break above $22.50-60 in the 1-hour chart, silver will resume its downtrend.
After losing for three straight days and reaching a new 2021 low at $22.03, Silver recovered is trading at $22.48, recording a 0.97% gain, at the time of writing.
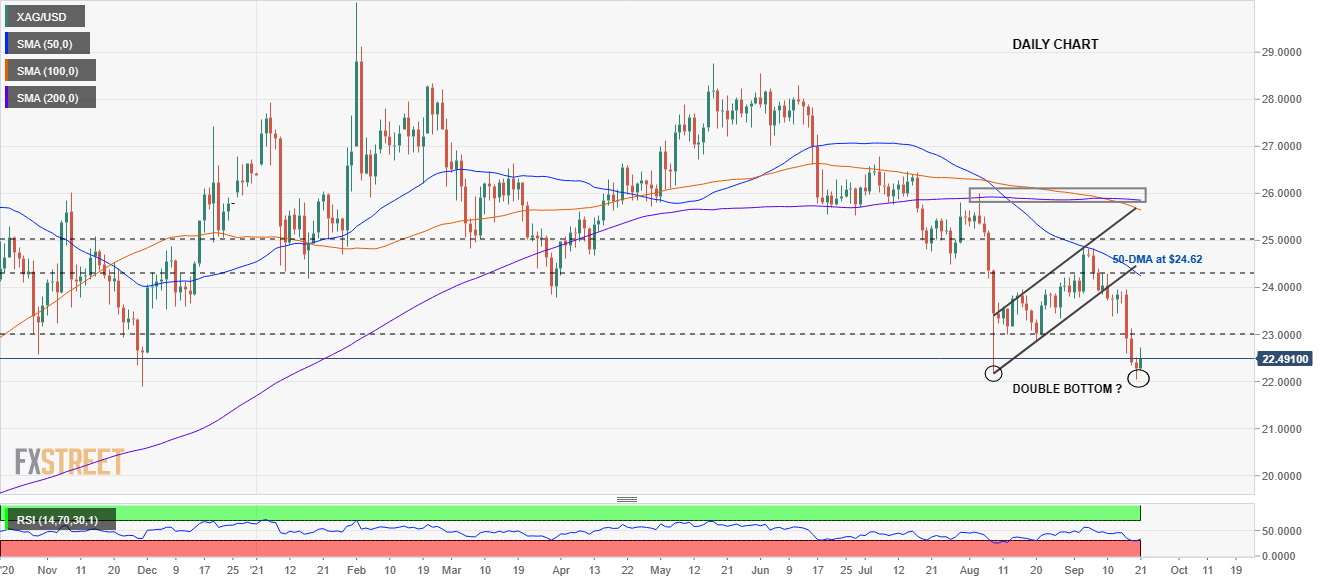
XAG/USD daily chart
Silver is in a downtrend, as the daily moving averages (DMA’s) remain well above the spot price. XAG/USD is trading near 2021 lows, within the $22.00-50 range. The first support on the downside would be the September 20 low at $22.03. A break of the latter would expose September 24, 2020 low at $21.65.
On the flip side, a double-bottom pattern is under formation. A break above $23.00 could expose $24.00 as the first resistance level. A daily close above that level will push XAG/USD towards the 50-day moving average at $24.24, followed by the September 3 high at $24.86.
The “neckline” of the double-bottom lies in that area. A decisive break of that supply zone could push the price towards the confluence of the 100 and the 200-DMA around $26.00.
The Relative Strength Index is at 33, aiming higher, but the downtrend remains intact as it remains below the 50-midline.
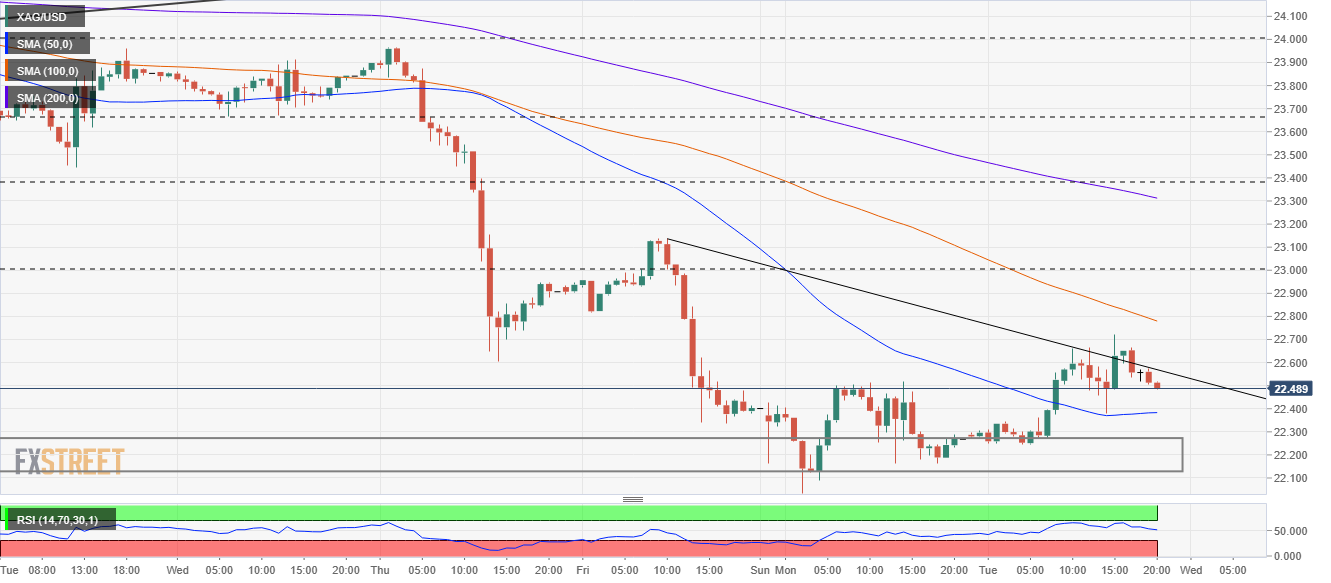
XAG/USD 1-hour chart
Zooming into the 1-hour chart, XAG/USD is in an uptrend. However, lying around the $22.50-60 range, a downslope trendline capped the upside movement. A break above the latter could pave the way for further gains. The first resistance would be the 100-simple moving average (SMA) at $22.78. The following supply zones would be $23.00 and the 200-SMA at $23.81.
On the flip side, failure at $22.50-60, then XAG/USD could resume its downtrend. The first support would be the 50-SMA at $22.38. The following demand zones would be $22.16 and 2021 low at $22.03
The Relative Strength Index is at 53, heading towards the 50-midline. If the RSI moves beneath the latter, it could exert downward pressure on XAG/USD.