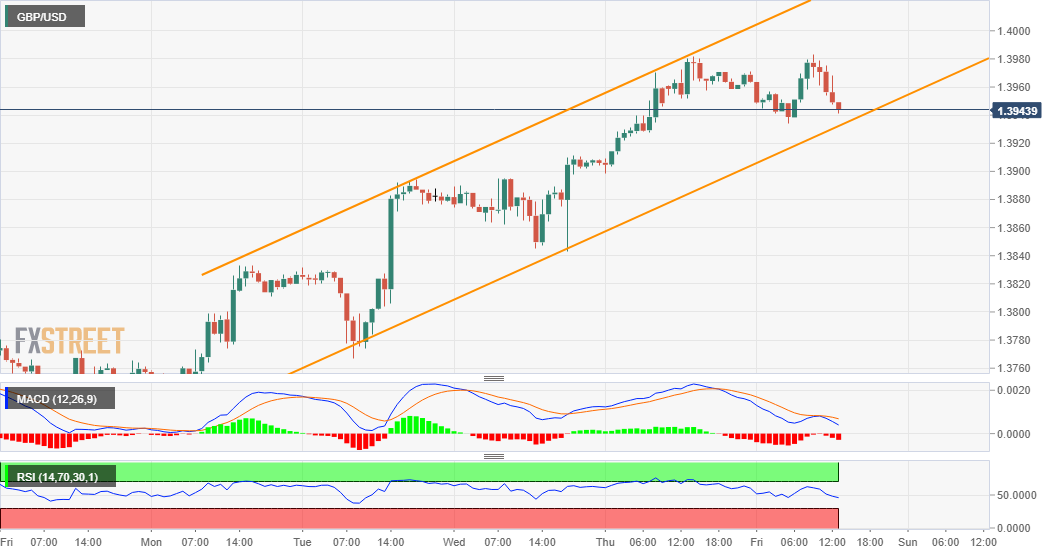
GBP/USD Price Analysis: Tests weekly ascending channel support, just below mid-1.3900s
- GBP/SUD stalled its recent strong move up near the 61.8% Fibo. level resistance.
- The risk-off impulse benefitted the safe-haven USD and capped any further gains.
- A sustained break below the 1.3900 mark is needed to negate the positive outlook.
The GBP/USD pair retreated around 40 pips from daily tops and has now dropped to the lower end of its intraday trading range, around the 1.3940 region.
The risk-off impulse in the markets drove some haven flows towards the US dollar. This, in turn, was seen as a key factor that failed to assist the GBP/USD pair to capitalize on its intraday positive move to the 1.3980-85 region, or over one-month tops.
From a technical perspective, the recent strong rebound from the lowest level since February stalled near the 61.8% Fibonacci level of the 1.4249-1.3572 downfall. That said, the formation of an ascending trend channel on hourly charts favours bullish traders.
The positive outlook is reinforced by the fact that technical indicators on the daily chart have been gaining positive traction and are still far from being in the overbought zone. Hence, any subsequent slide might be limited near the trend-channel support.
However, a sustained break below might prompt some technical selling and accelerate the corrective pullback towards the 1.3900 mark. The latter coincides with the 50% Fibo. level, which if broken decisively will set the stage for further weakness.
The GBP/USD pair might then extend the fall towards the 1.3860 horizontal support en-route the 38.2% Fibo. level, around the 1.3830-25 region. Some follow-through selling below the 1.3800 mark will shift the near-term bias back in favour of bearish traders.
On the flip side, the 1.3980-85 region (61.8% Fibo. level) might continue to act as an immediate hurdle. This is closely followed by the key 1.4000 psychological mark ahead of the top end of the mentioned trend-channel resistance, around the 1.4015 region.
A convincing breakthrough will be seen as a fresh trigger for bullish traders and push the GBP/USD pair further towards the 1.4070-75 intermediate resistance. The momentum could further get extended and allow bulls to aim back to reclaim the 1.4100 round figure.
GBP/USD 1-hour chart

Technical levels to watch
