WTI Price Analysis: Bulls battle the key Fibonacci Retracement on the way to $64.00
- WTI stays firmer while keeping the bounce off previous resistance line.
- Receding bearish bias of MACD, sustained trading beyond 200-SMA favor bulls.
WTI prints mild gains while picking up bids near $63.60 during Tuesday’s Asian session. The energy benchmark bounced off an ascending support line, previous resistance, from March 22 the previous day.
In doing so, the quote remains above 200-SMA amid the receding bearish bias of MACD signals.
However, a clear break above 61.8% Fibonacci retracement of March 08-23 downside, around $63.80 tests the WTI bulls off-late.
It’s worth mentioning that the black gold’s ability to stay past $63.80 needs validation from the $64.00 threshold before eyeing the March 17 top near $65.40 and the mid-March peak surrounding $66.45.
Meanwhile, pullback moves below the stated support line near $62.70 may dwindle around 50% Fibonacci retracement level of $62.55 and 200-SMA, around 62.00 by the press time.
Overall, WTI is on the bullish trajectory towards the previous month’s top near $67.85.
WTI four-hour chart
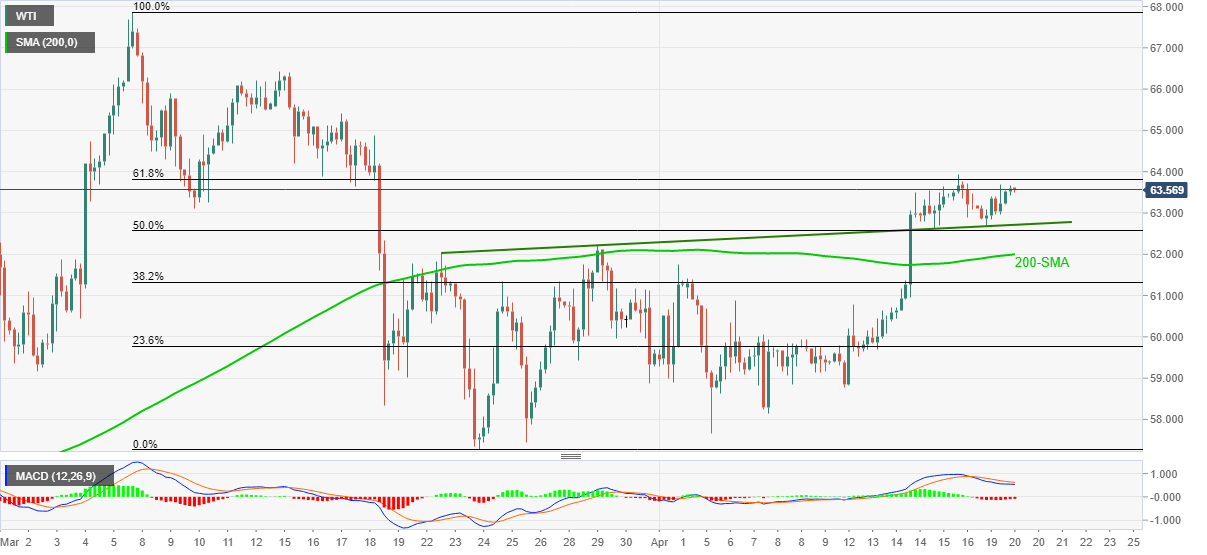
Trend: Bullish