EUR/GBP Price Analysis: Clings to strong gains near one-week tops, around mid-0.8500s
- A strong pickup in demand for the euro prompted an intraday short-covering around EUR/GBP.
- A sustained move beyond 200-hour SMA was also seen as a trigger for intraday bullish traders.
- Overbought RSI on the 1-hour chart, bearish oscillators on the daily chart warrant some caution.
The EUR/GBP cross witnessed an aggressive short-covering move on Tuesday and rallied to one-week tops, around mid-0.8500s during the mid-European session.
The shared currency got a strong lift following a Bloomberg report that the EU may hit its vaccination target much earlier than projected – by the end of June. Apart from this, the emergence of some selling around the British pound provided an additional boost to the EUR/GBP cross.
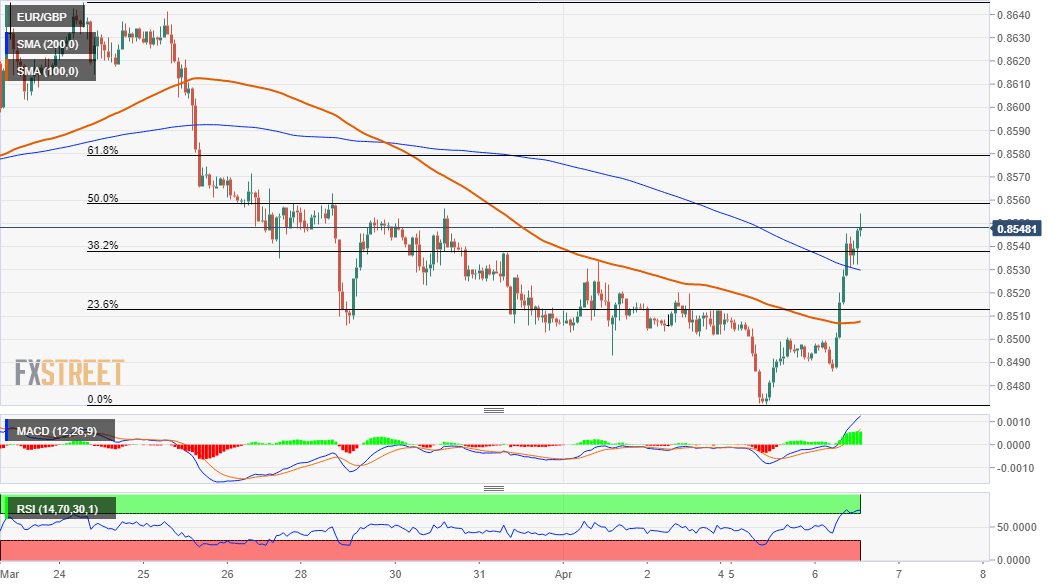
Looking at the technical picture, extremely oversold RSI (14) on the daily chart turned out to be a key factor that assisted the EUR/GBP cross to rebound swiftly from over one-year lows. A sustained move beyond 200-hour SMA was seen as another trigger for intraday bullish traders.
Meanwhile, oscillators on the daily chart have recovered from the negative territory but are yet to confirm a bullish bias. This makes it prudent to wait for some follow-through buying before confirming that the EUR/GBP cross has bottomed out and positioning for any further gains.
From current levels, a subsequent move up is likely to confront some resistance near the 0.8575-80 region, above which the EUR/GBP cross might aim to reclaim the 0.8600 mark. The next relevant tarted on the upside is pegged near the 0.8630 supply zone ahead of mid-0.8600s.
On the flip side, the 100-hour SMA, currently around the 0.8530-25 region now seems to protect the immediate downside. This is followed by the key 0.8500 psychological mark, which if broken might turn the EUR/GBP cross vulnerable to resume its well-established bearish trend.
Bearish traders might then drag the EUR/GBP cross back towards the 0.8470 region, or the lowest level since February 2020 touched in the previous session.
EUR/GBP 1-hour chart
Technical levels to watch