USD/CHF Price Analysis: Sluggish above 0.9500 inside weekly symmetrical triangle
- USD/CHF recoveries from 0.9482 fail to defy one-week-old chart formation.
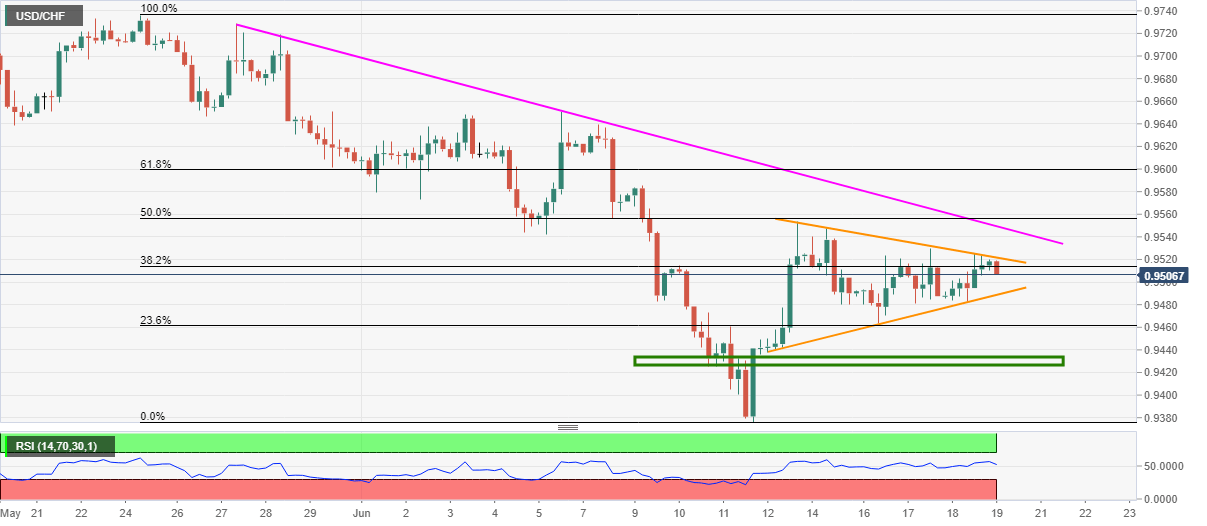
- Another falling trend line from May 27 adds to the upside barriers.
- 0.9430/35 can question sellers on the triangle’s downside break.
USD/CHF drops to 0.9510, down 0.05% on a day, during the early Friday. The pair’s latest fall could be traced from its pullback from a short-term symmetrical triangle on the four-hour chart.
Hence, the traders may expect further declines towards the pattern’s support line near 0.9485. However, the quote’s downside below the triangle’s support could quickly drag it to 0.9430/35 horizontal area.
If at all there prevails additional weakness past-0.9430, the monthly bottom near 0.9375 and 0.9320 may act as buffers during the slump to May month trough surrounding 0.9180.
Assuming the pair’s recoveries, an upside clearance of 0.9525 resistance will need validation from a three-week-old falling trend line, at 0.9550 to justify the strength in momentum.
As a result, the buyers could aim for 0.9600 and the monthly top close to 0.9650 during the additional rise past-0.9550.
USD/CHF four-hour chart
Trend: Sideways