Gold Price Analysis: Topping strong resistance at $1,635 key to the upside – Confluence Detector
Gold has been retreating from the highs as the market mood improves despite rising infections from coronavirus. How will the precious metal end the week?
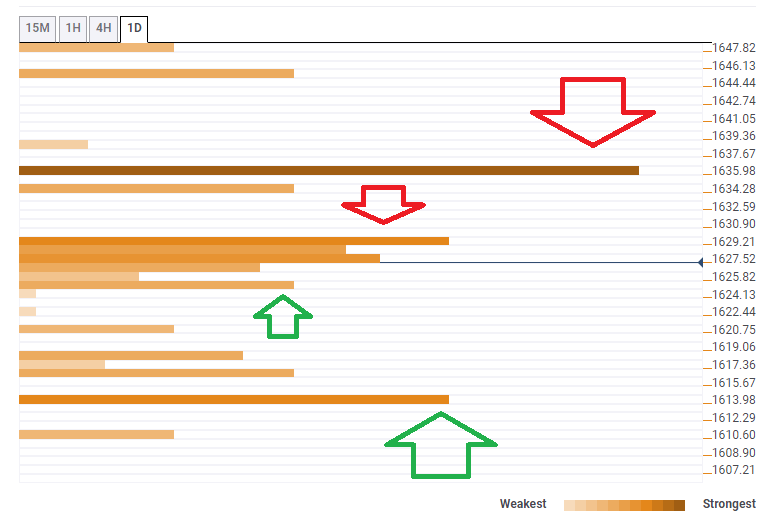
The Technical Confluences Indicator is showing that XAU/USD is capped at $1,629, which is the convergence of the Bollinger Band 1h-Middle, the Simple Moving Average 50-15m, and the Fibonacci 161.8% one-week.
Critical resistance awaits at $1,635, which is the meeting point of the Fibonacci 23.6% one-day and the Fibonacci 61.8% one-month.
Some support awaits at $1,624, which is the confluence of the SMA 10-15m, the BB 15min-Middle, and the BB 15min-Lower.
Stronger support is at $1,613, which is where the Pivot Point one-week R2 meets the price.
Here is how it looks on the tool:
Confluence Detector
The Confluence Detector finds exciting opportunities using Technical Confluences. The TC is a tool to locate and point out those price levels where there is a congestion of indicators, moving averages, Fibonacci levels, Pivot Points, etc. Knowing where these congestion points are located is very useful for the trader, and can be used as a basis for different strategies.
This tool assigns a certain amount of “weight” to each indicator, and this “weight” can influence adjacents price levels. These weightings mean that one price level without any indicator or moving average but under the influence of two “strongly weighted” levels accumulate more resistance than their neighbors. In these cases, the tool signals resistance in apparently empty areas.
Learn more about Technical Confluence