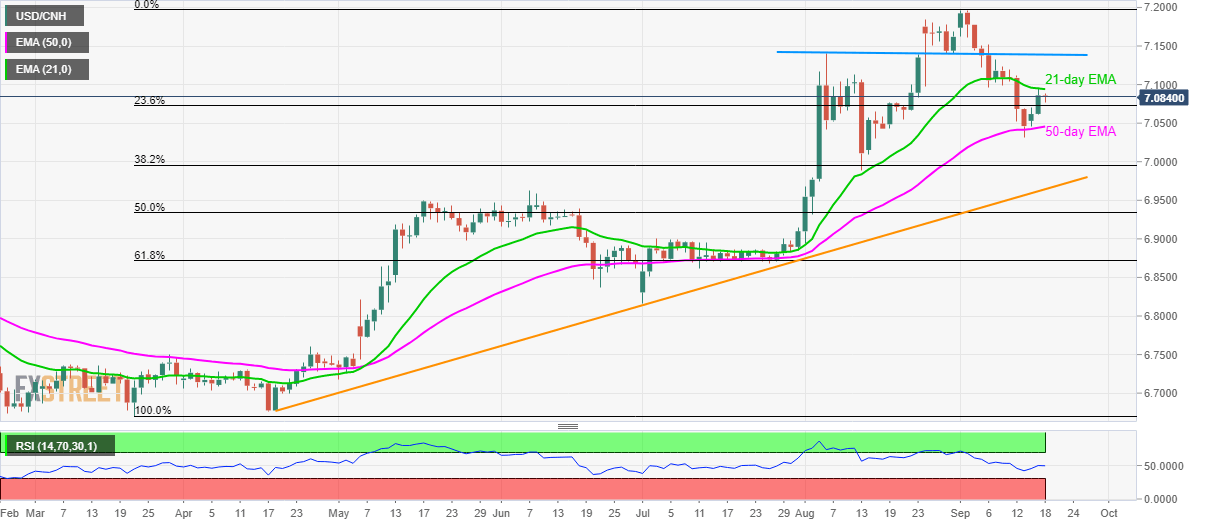
USD/CNH technical analysis: 21-day EMA holds the key to 7.1390/1400 horizontal resistance
- USD/CNH has been trading below 21-day EMA for the last four days.
- 23.6% Fibonacci retracement offers immediate support ahead of 50-day EMA and five-month-old rising trend-line.
Despite successfully trading beyond 23.6% Fibonacci retracement of March-September upside, USD/CNH stays below the 21-day exponential moving average (EMA) as it makes the rounds to 7.0850 during early Wednesday.
The quote needs to provide a daily closing beyond 21-day EMA level of 7.0950 in order to aim for 7.1390/1400 horizontal area including multiple highs/lows marked during August.
Should prices successfully rise beyond 7.1400, monthly top close to 7.1970 and 7.2000 will be on the bulls’ radar.
Meanwhile, the pair’s break below 23.6% Fibonacci retracement level of 7.0725 can take rest on 50-day EMA, at 7.0457 now. However, 38.2% Fibonacci retracement level of 6.9957 and an upward sloping trend-line since April near 6.9644 could question sellers afterward.
USD/CNH daily chart

Trend: bullish
