Back
12 Jul 2019
EUR/USD technical anlysis: Fiber breaks above 1.1263 within its daily range
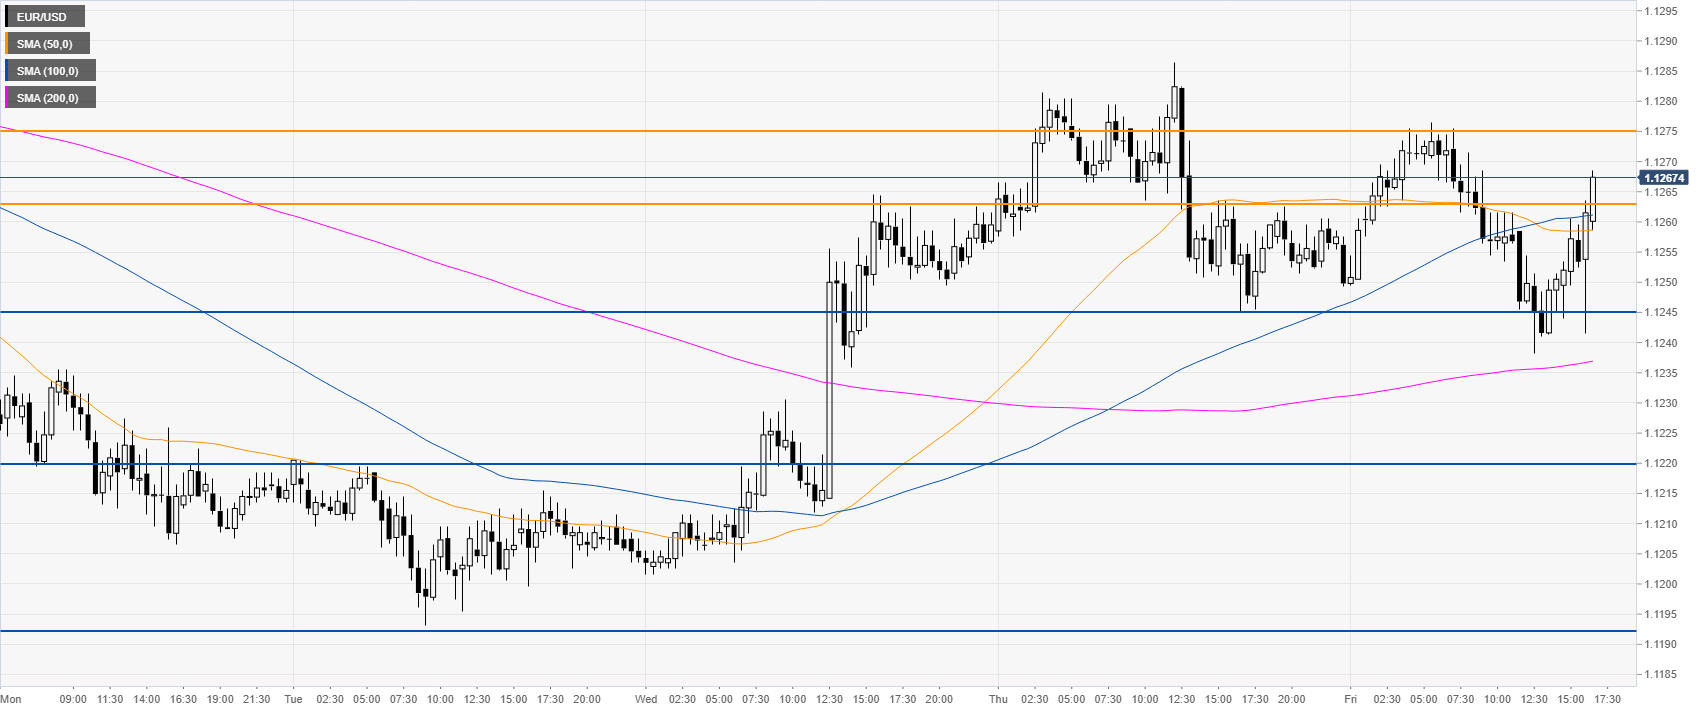
- EUR/USD breaks above 1.1263 opening the doors to 1.1274 resistance.
- The level to beat for sellers is 1.1245 followed by 1.1220.
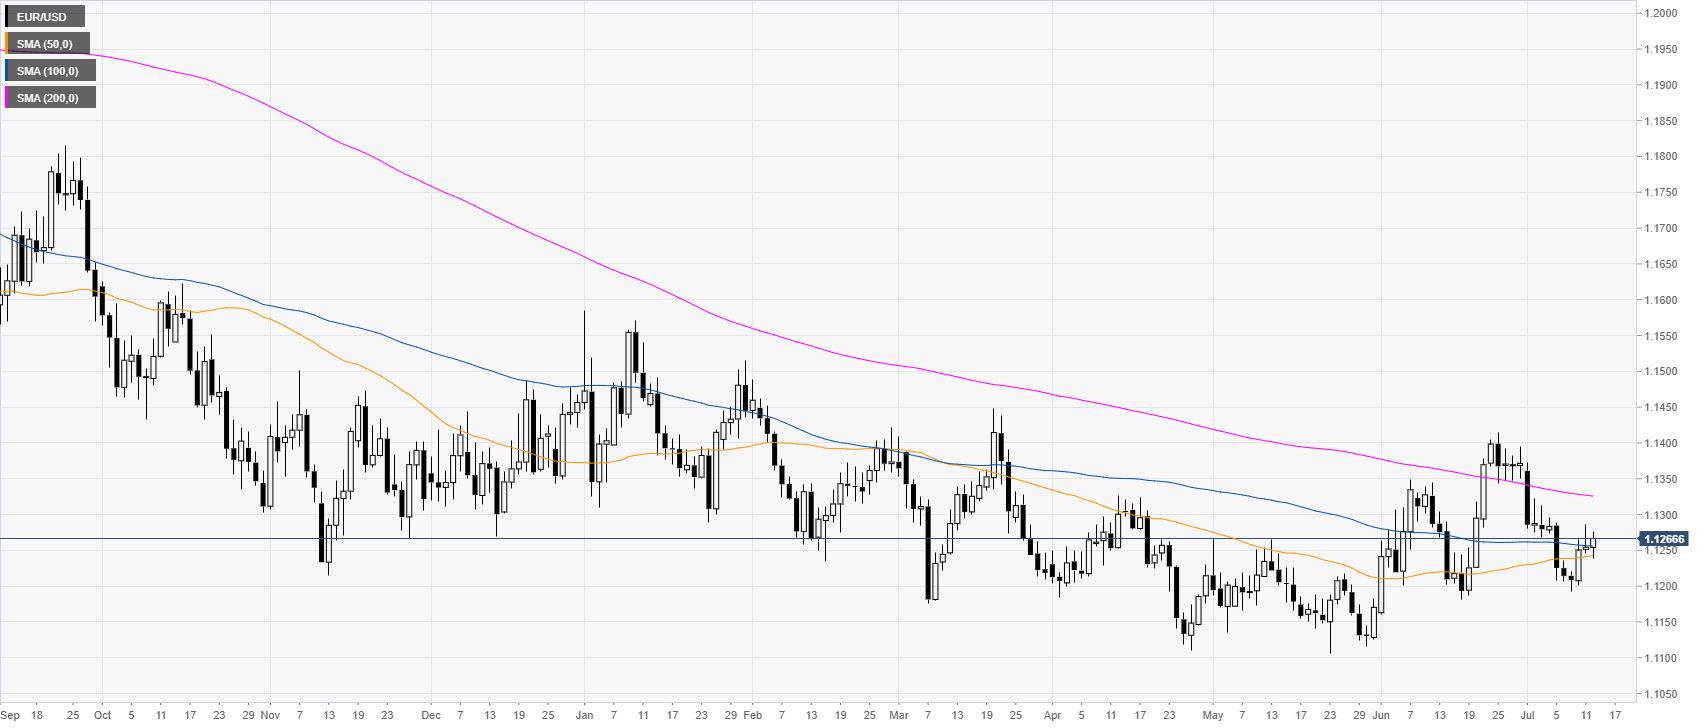
EUR/USD daily chart
EUR/USD is in a bear trend below the 1.1300 handle and its 200-day simple moving averages (DSMAs). The market is trading just above the 100 SMA.

EUR/USD 4-hour chart
EUR/USD broke above 1.1263 resistance opening the doors to 1.1274 resistance, according to the Technical Confluences Indicator.

EUR/USD 30-minute chart
EUR/USD is trading above its main SMAs suggesting bullish momentum in the near term. If bears want to retake control they would need a beak below 1.1245 support followed by 1.1220.

Additional key levels
