Back

US Dollar Index Technical Analysis: There is room to the upside

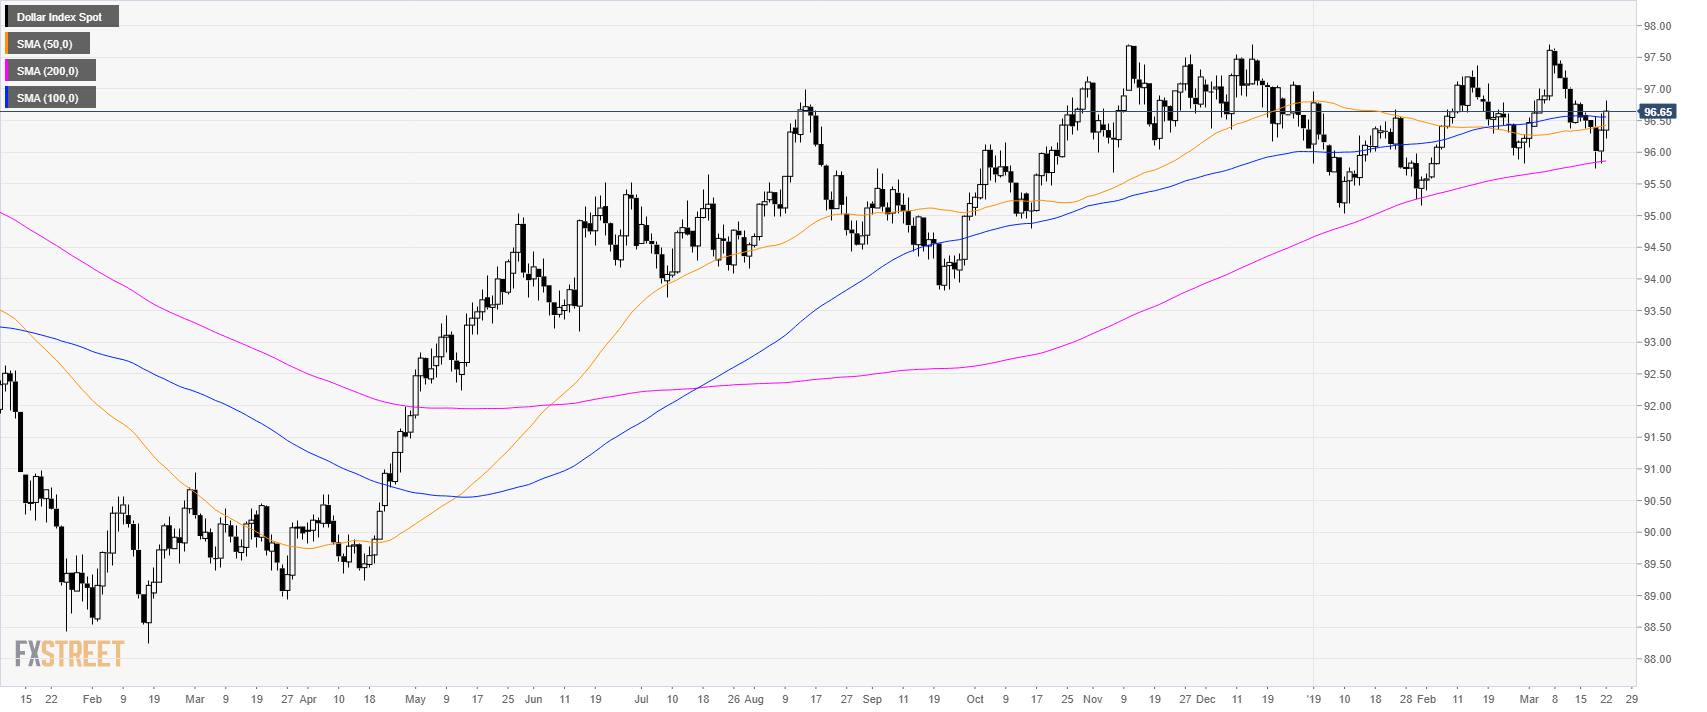
DXY daily chart

  • The US Dollar Index (DXY) is trading in a bull trend above its 200-day simple moving average (SMA).
DXY 4-hour chart

  • DXY is reversing up from 95.80 support.
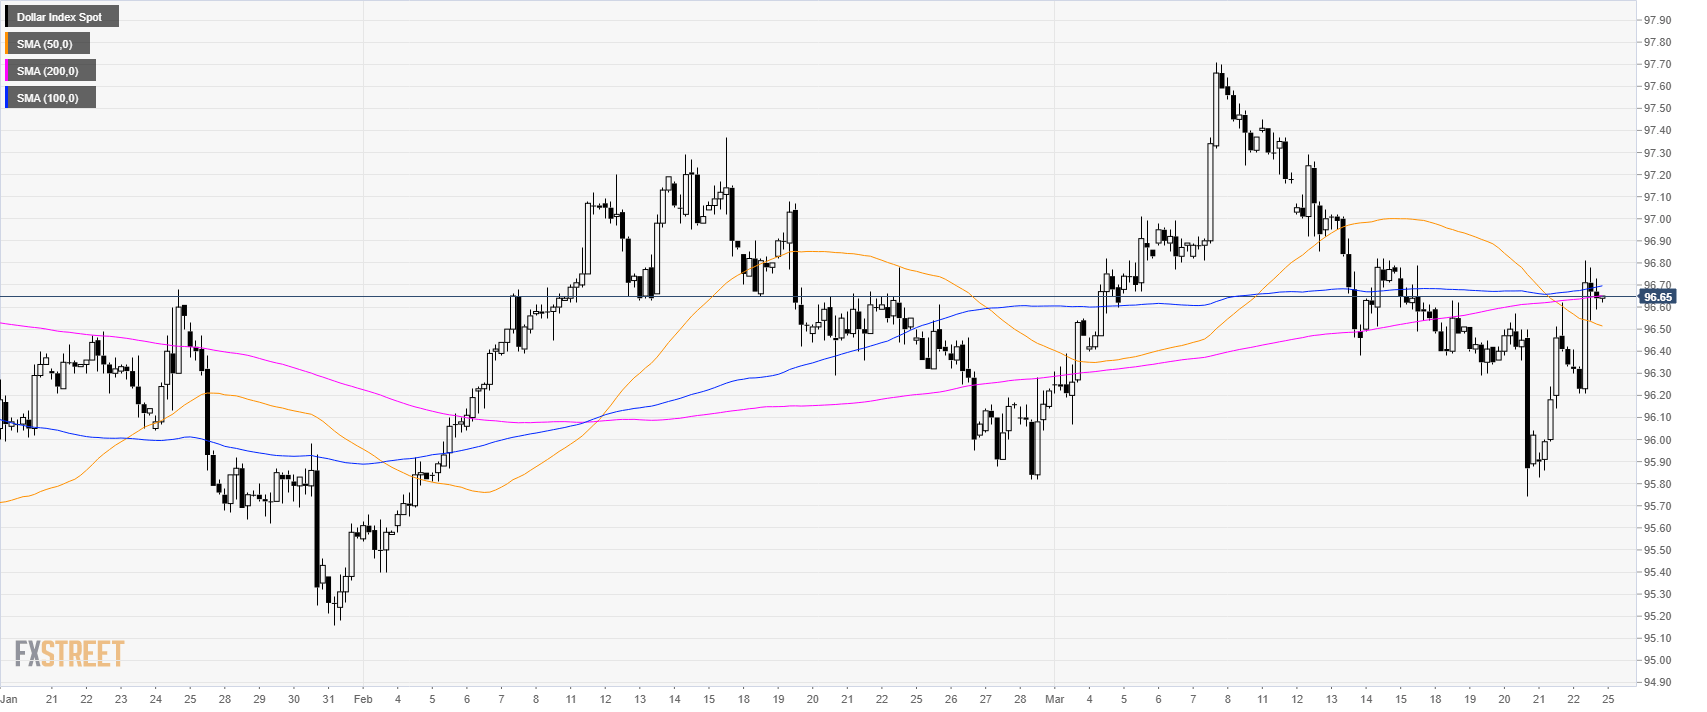
DXY 30-minute chart

  • DXY is trading above its main SMAs suggesting bullish momentum in the short-term.
  • 96.80, 97.00 and 97.40 can be on the bulls radar. 
  • Support is at 97.30, 97.10 and 95.90 level.

Additional key levels


Eurozone: Lack of enthusiasm for the economy and the euro - Wells Fargo

Today Eurozone PMI reports triggered fears about a recession. According to analysts at Wells Fargo, the manufacturing has weakened considerably, but s
Baca lagi Previous

US: PCE core inflation, housing and speeches from FOMC members - Danske Bank

According to analysts from Danske Bank, the US PCE core inflation is expected to remain at 1.9% (annual), below the Federal Reserve 2% target. Key Qu
Baca lagi Next