Back
20 Mar 2019
Oil Technical Analysis: WTI soars to $60.21 a barrel
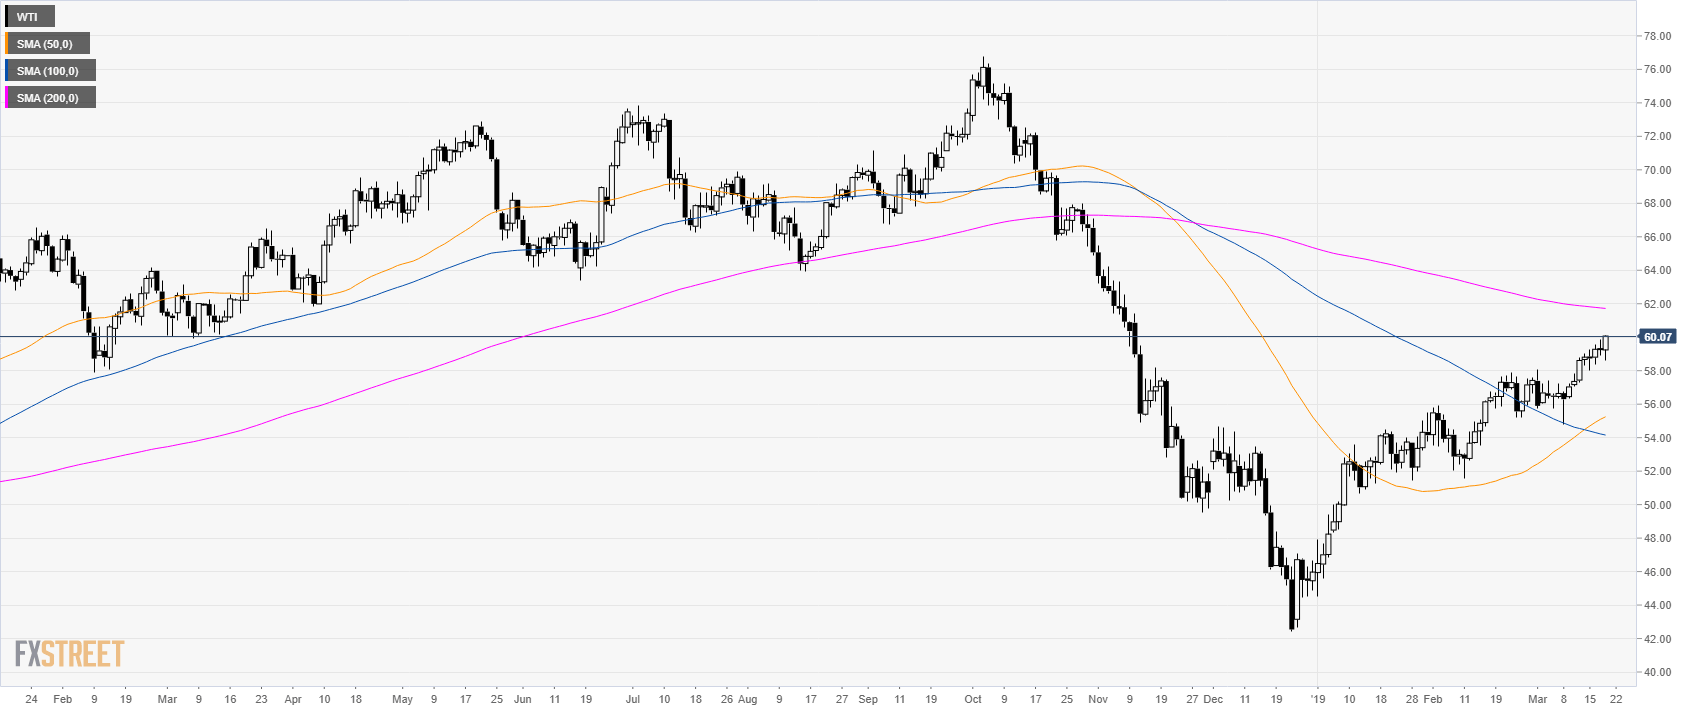
Oil daily chart
- Oil is trading above the 50 and 100-day simple moving averages (SMAs) suggesting a bullish bias.

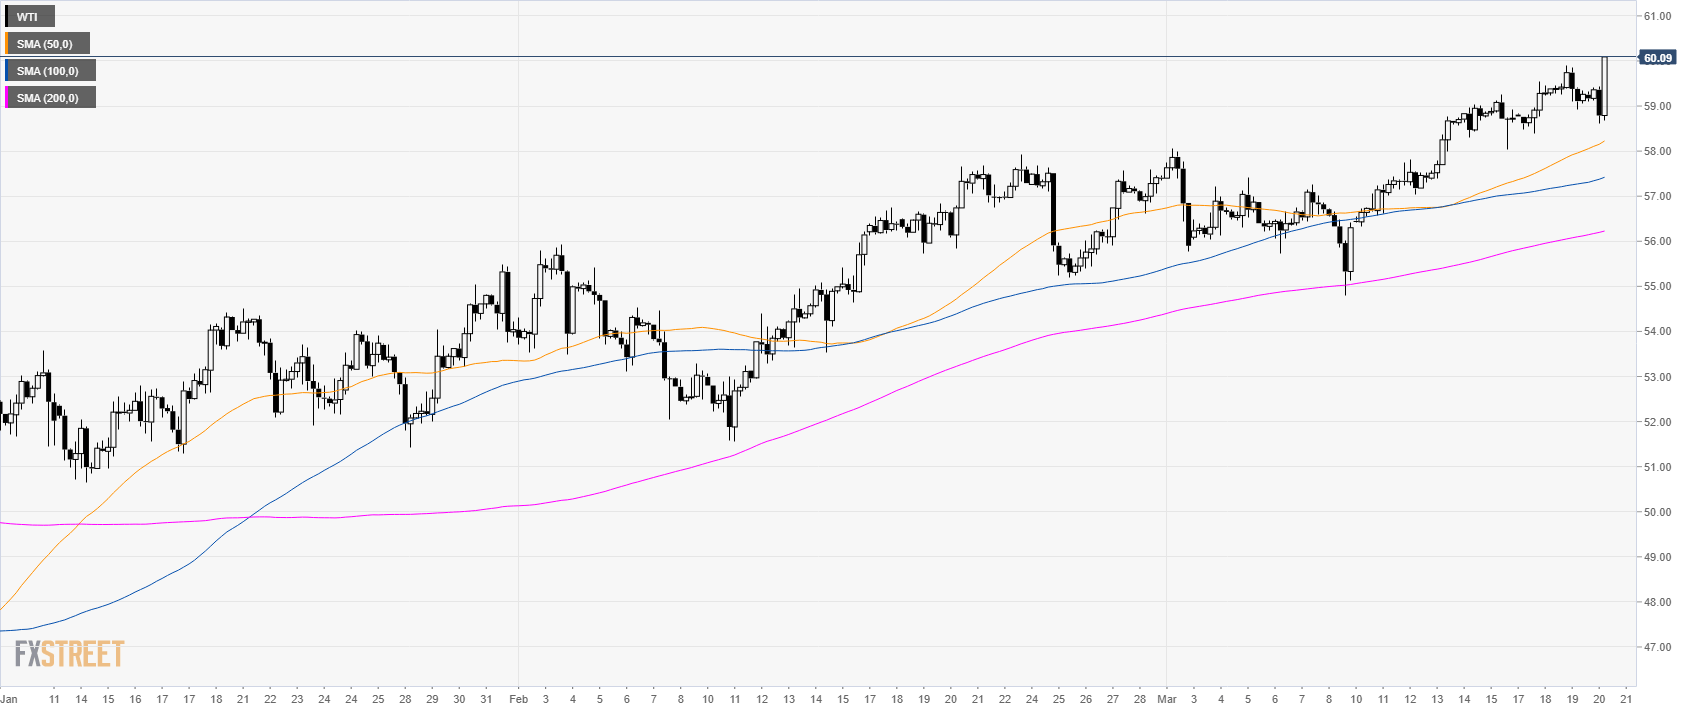
Oil 4-hour chart
- Crude oil WTI is trading above its main SMAs suggesting a bullish bias in the medium-term.

Oil 30-minute chart
- Oil is trading above its main SMAs suggesting bullish momentum in the near-term.
- The level to beat for bulls is 60.20. The next resistances to the upside are at 60.60 and 61.00 figure.
- To the downside, supports are at 59.30 and 59.00 level.

Additional key levels
