EUR/USD Technical Analysis: Euro challenging last week highs as bulls eye the 1.1400 figure
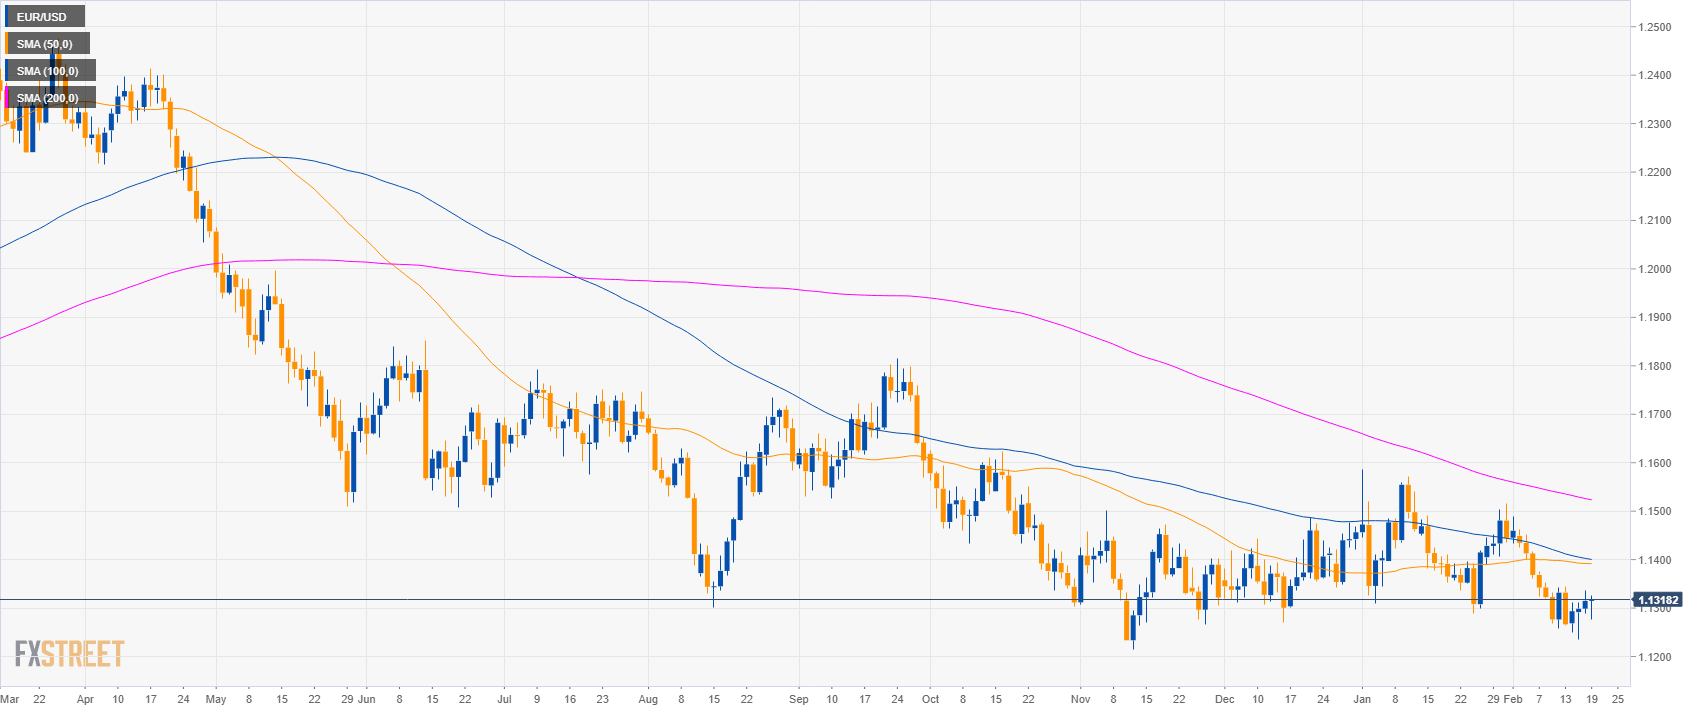
EUR/USD daily chart
- EUR/USD is trading in a bear trend below the 200-day simple moving average (SMA).
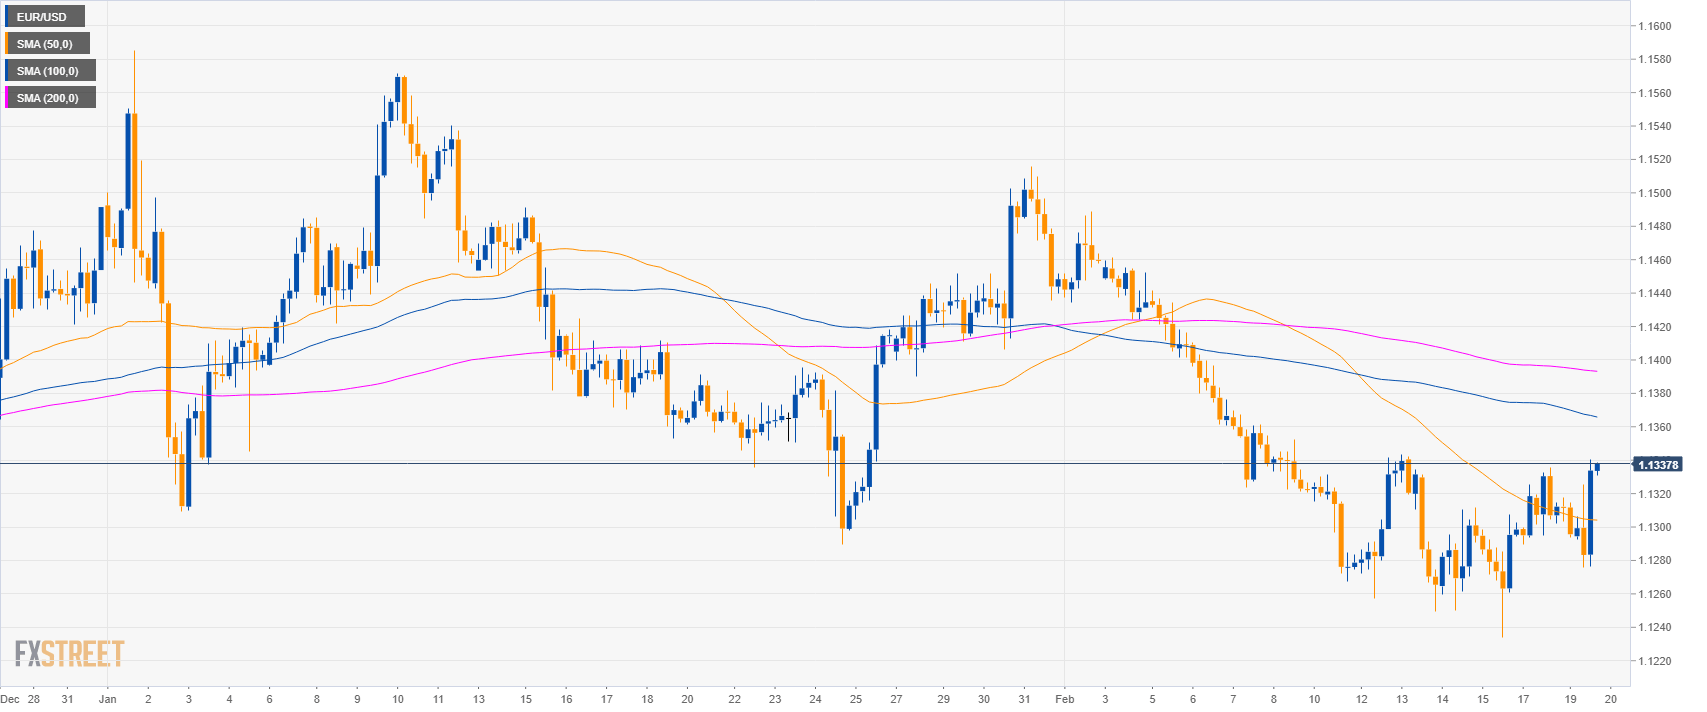
EUR/USD 4-hour chart
- EUR/USD is trading between the 50 and 100 SMAs suggesting sideways action in the in the medium-term.
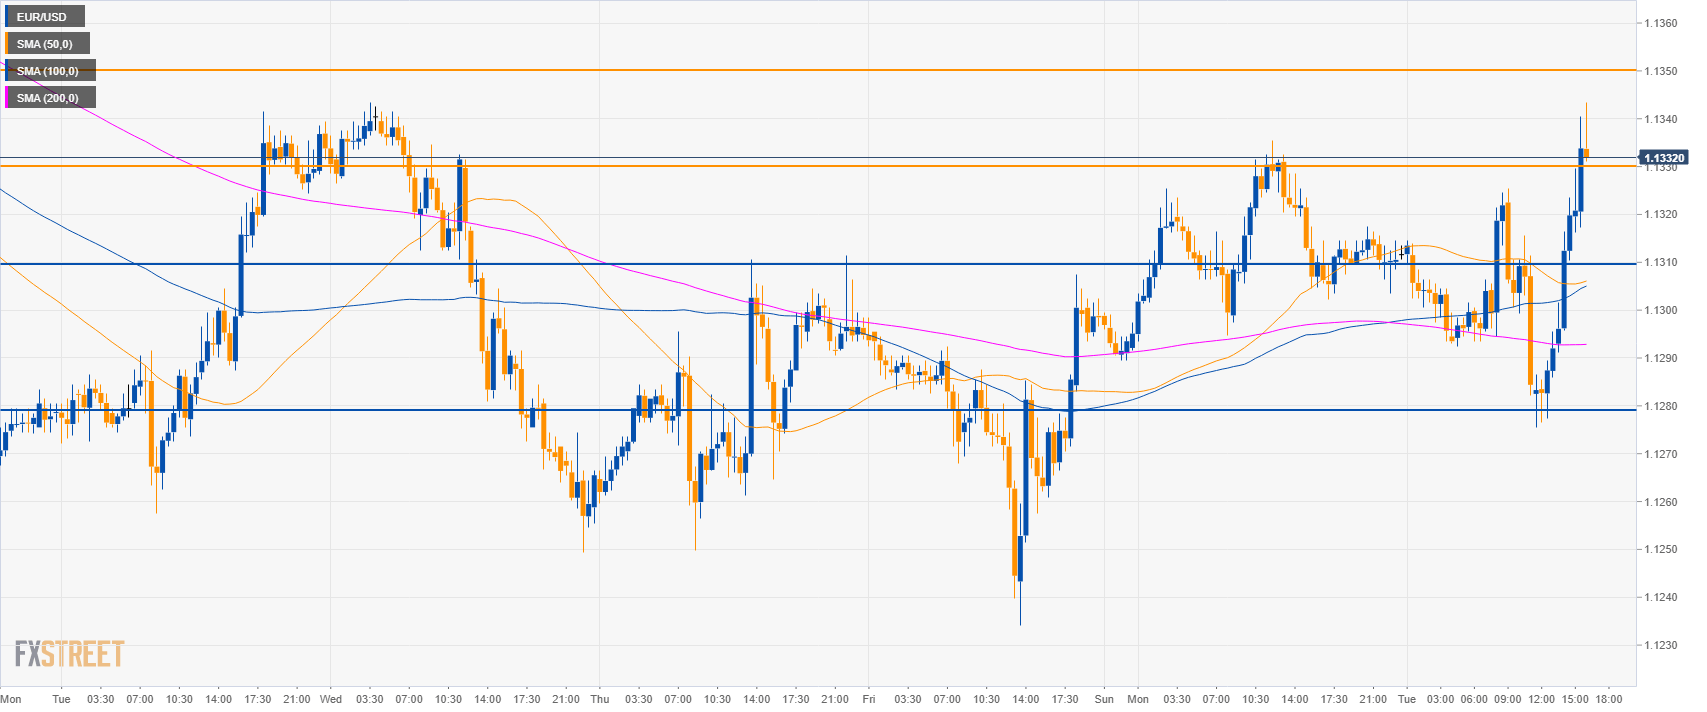
EUR/USD 30-minute chart
- EUR/USD is trading above the main SMAs suggesting bullish momentum in the short-term.
- The break above 1.1330 should lead to 1.1350 key resistance and 1.1400 figure in the coming sessions.
- To the downside, support is seen at 1.1310 and 1.1280 level.
Additional key levels
EUR/USD
Overview:
Today Last Price: 1.1334
Today Daily change: 19 pips
Today Daily change %: 0.17%
Today Daily Open: 1.1315
Trends:
Daily SMA20: 1.1368
Daily SMA50: 1.1392
Daily SMA100: 1.1402
Daily SMA200: 1.1526
Levels:
Previous Daily High: 1.1336
Previous Daily Low: 1.1289
Previous Weekly High: 1.1344
Previous Weekly Low: 1.1234
Previous Monthly High: 1.1586
Previous Monthly Low: 1.1289
Daily Fibonacci 38.2%: 1.1318
Daily Fibonacci 61.8%: 1.1307
Daily Pivot Point S1: 1.1291
Daily Pivot Point S2: 1.1267
Daily Pivot Point S3: 1.1245
Daily Pivot Point R1: 1.1337
Daily Pivot Point R2: 1.1359
Daily Pivot Point R3: 1.1383