EUR/GBP Technical Analysis: Euro challenging the 0.8950 level ahead of the Brexit vote
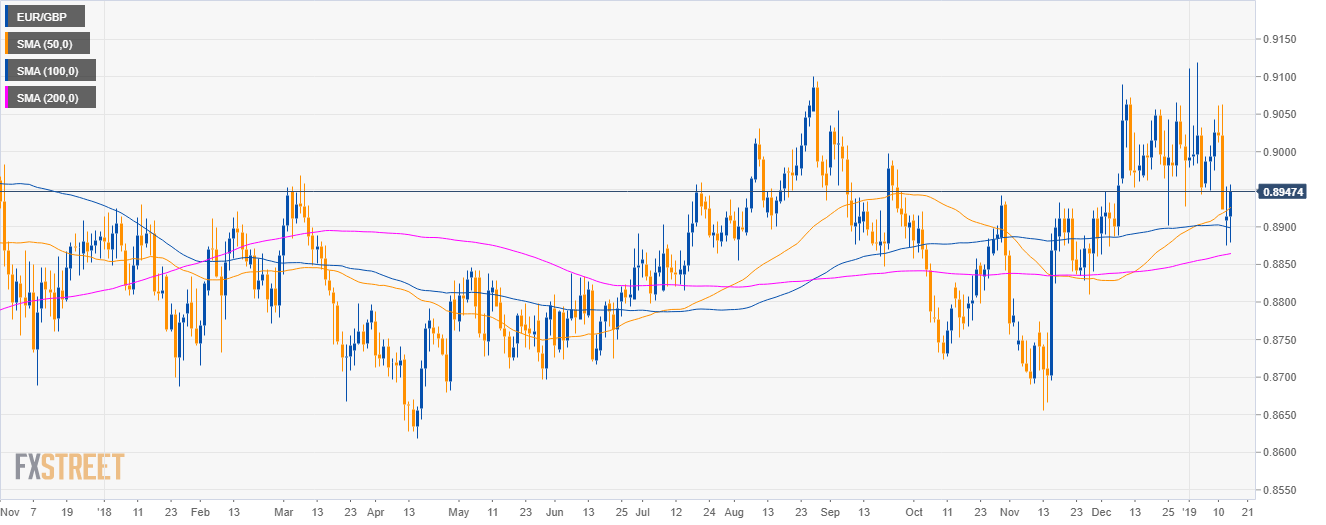
EUR/GBP daily chart
- EUR/GBP is trading in a bull trend above the 200-period simple moving average (SMA).
- The Brexit vote at 20.00 GMT is likely to lead to high market volatility.
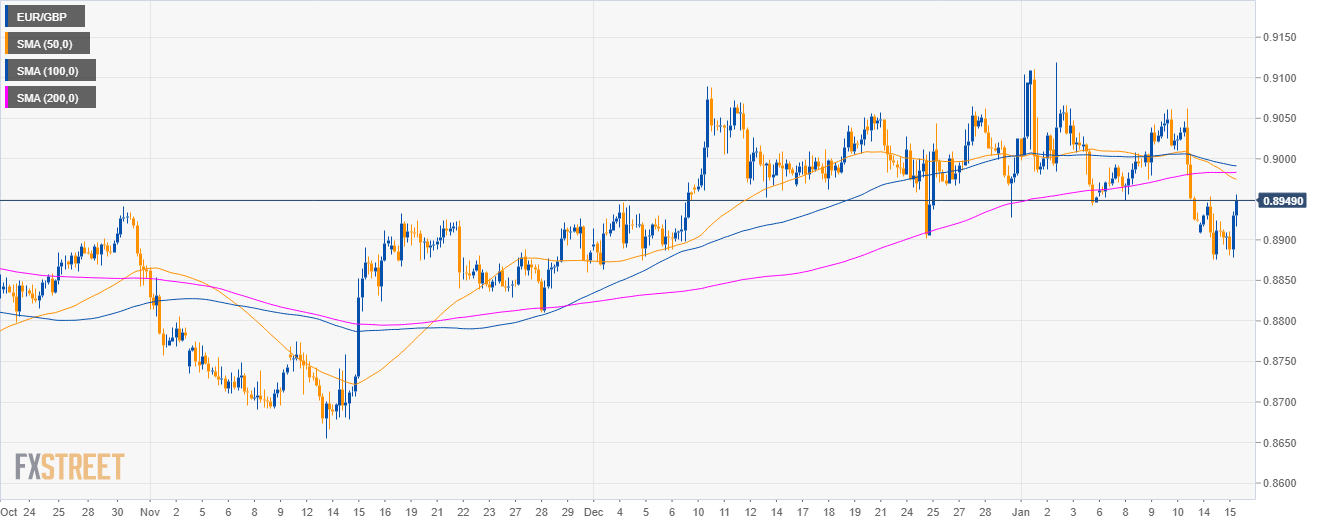
EUR/GBP 4-hour chart
- EUR/GBP is trading below the 0.9000 figure and its main SMAs.
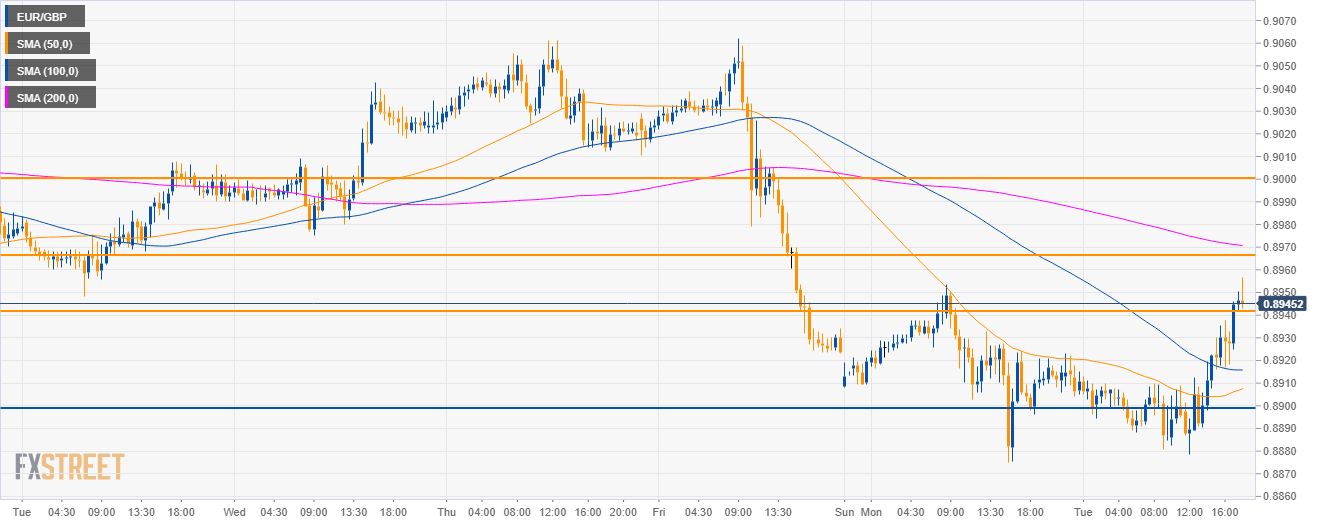
EUR/GBP 30-minute chart
- Bulls reclaimed the 0.8900 figure along with the 50 and 100 SMA.
- The level to beat to the upside is the 0.8966 level. A break above it would open the door to 0.9000 the figure.
- To the downside, bears still have a chance to retest the 0.8900 figure.
Additional key levels
EUR/GBP
Overview:
Today Last Price: 0.8952
Today Daily change: 39 pips
Today Daily change %: 0.438%
Today Daily Open: 0.8913
Trends:
Previous Daily SMA20: 0.8994
Previous Daily SMA50: 0.8922
Previous Daily SMA100: 0.89
Previous Daily SMA200: 0.8863
Levels:
Previous Daily High: 0.8954
Previous Daily Low: 0.8875
Previous Weekly High: 0.9062
Previous Weekly Low: 0.8923
Previous Monthly High: 0.9089
Previous Monthly Low: 0.8863
Previous Daily Fibonacci 38.2%: 0.8924
Previous Daily Fibonacci 61.8%: 0.8905
Previous Daily Pivot Point S1: 0.8874
Previous Daily Pivot Point S2: 0.8836
Previous Daily Pivot Point S3: 0.8796
Previous Daily Pivot Point R1: 0.8953
Previous Daily Pivot Point R2: 0.8992
Previous Daily Pivot Point R3: 0.9031