NZD/USD Price Forecast: Targets 0.5950 support near 50-day EMA
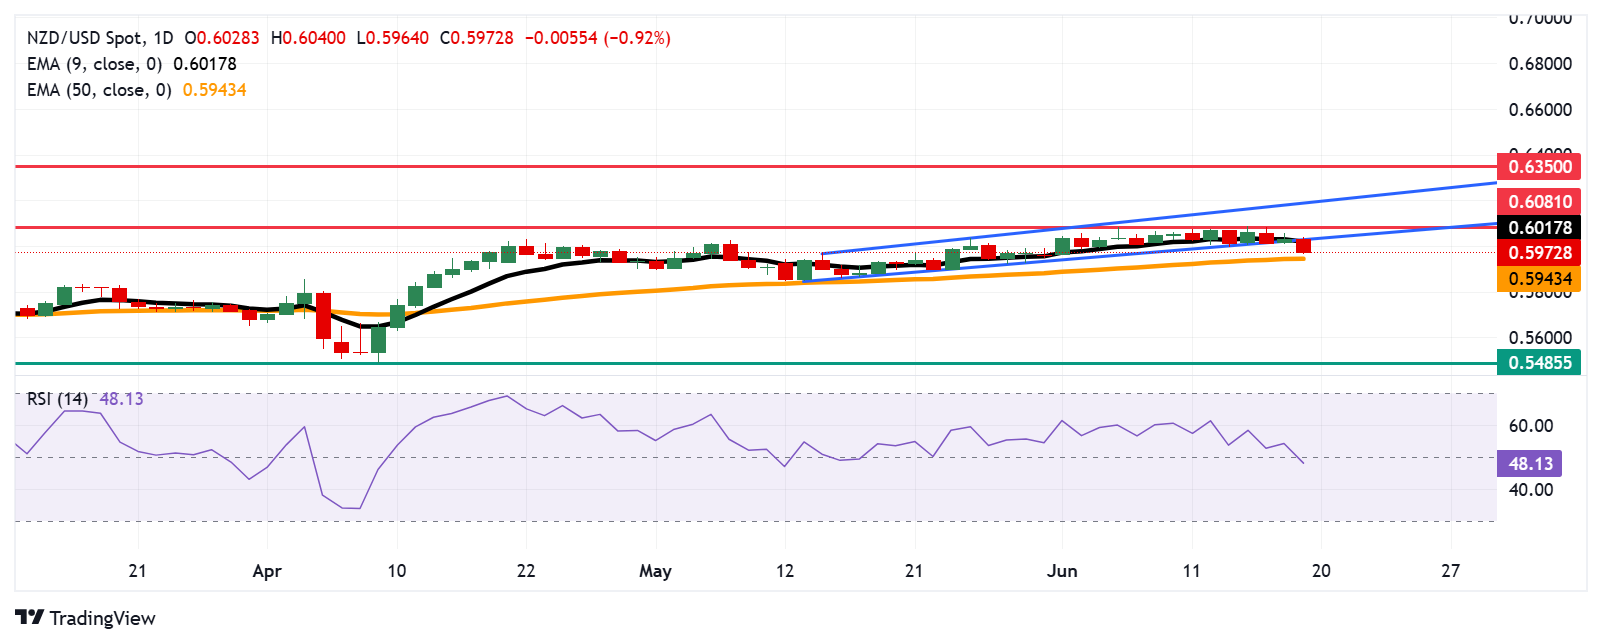
- NZD/USD may find initial support near the 50-day EMA at 0.5943.
- A bearish outlook emerges as the pair has breached below the ascending channel.
- A successful recovery to the ascending channel would support the pair to test the nine-day EMA of 0.6017.
NZD/USD falls nearly 1% on Thursday, trading around 0.5970 during the early European hours on Thursday. The technical analysis of the daily chart suggests the emergence of a bearish bias, as the pair has broken below the lower boundary of the ascending channel pattern.
The short-term price momentum is weaker as the NZD/USD pair is falling below the nine-day Exponential Moving Average (EMA). Additionally, the bearish outlook strengthens as the 14-day Relative Strength Index (RSI) is also positioned below the 50 mark.
On the downside, the NZD/USD pair is poised to target the 50-day EMA at 0.5943. A break below this level could weaken the medium-term price momentum and pave the way for a deeper decline toward 0.5485, the lowest level since March 2020.
The NZD/USD pair may attempt to rebound toward the ascending channel and target the nine-day EMA of 0.6017, followed by the eight-month high of 0.6081, which was reached on June 5. A successful break above this level may revive the bullish bias and support the pair to approach the upper boundary of the ascending channel around the psychological level of 0.6200. Further resistance appears around the nine-month high of 0.6350, recorded in October 2024.
NZD/USD: Daily Chart
New Zealand Dollar PRICE Today
The table below shows the percentage change of New Zealand Dollar (NZD) against listed major currencies today. New Zealand Dollar was the weakest against the US Dollar.
| USD | EUR | GBP | JPY | CAD | AUD | NZD | CHF | |
|---|---|---|---|---|---|---|---|---|
| USD | 0.09% | 0.14% | 0.12% | 0.23% | 0.71% | 0.96% | 0.21% | |
| EUR | -0.09% | 0.02% | -0.03% | 0.05% | 0.53% | 0.80% | 0.07% | |
| GBP | -0.14% | -0.02% | -0.04% | 0.03% | 0.51% | 0.87% | 0.24% | |
| JPY | -0.12% | 0.03% | 0.04% | 0.09% | 0.45% | 0.76% | 0.18% | |
| CAD | -0.23% | -0.05% | -0.03% | -0.09% | 0.39% | 0.74% | 0.20% | |
| AUD | -0.71% | -0.53% | -0.51% | -0.45% | -0.39% | 0.40% | -0.34% | |
| NZD | -0.96% | -0.80% | -0.87% | -0.76% | -0.74% | -0.40% | -0.67% | |
| CHF | -0.21% | -0.07% | -0.24% | -0.18% | -0.20% | 0.34% | 0.67% |
The heat map shows percentage changes of major currencies against each other. The base currency is picked from the left column, while the quote currency is picked from the top row. For example, if you pick the New Zealand Dollar from the left column and move along the horizontal line to the US Dollar, the percentage change displayed in the box will represent NZD (base)/USD (quote).