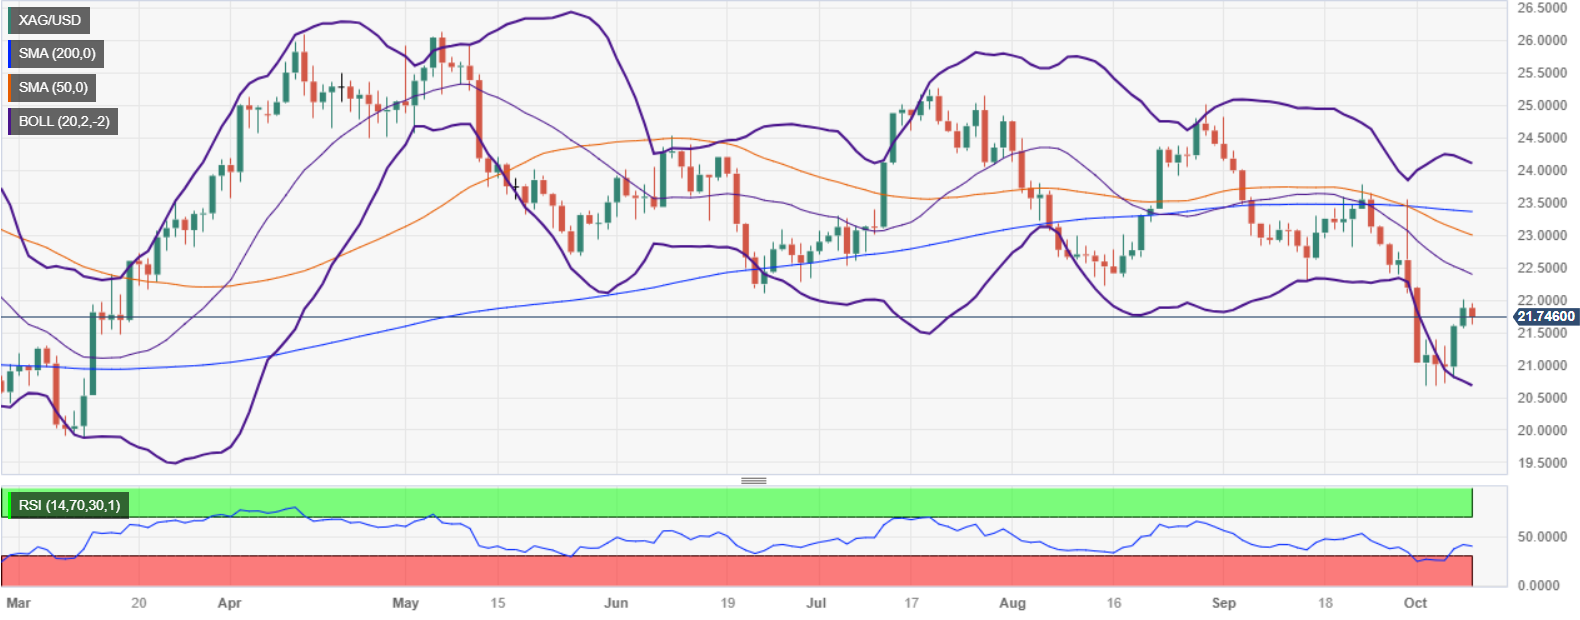
Silver Price Analysis: XAG/USD dips below $22 as bearish harami pattern looms
- Silver price struggles beneath the $22 mark, forming a bearish 'harami' pattern on daily charts.
- Potential bearish continuation looms, with sights set on the October 9 low of $21.57.
- Recovery above $22.00 necessitates claiming $22.11, with subsequent hurdles noted at 20-day EMA.
Silver price (XAG/USD) loses some of its bright, retreats from around weekly highs of $22.01 and is back below the figure, exchanging hands at around $21.75, even though US Treasury bond yields continued to extend their losses.
The daily chart portrays the white metal was shy of reclaiming the June 23 swing low of $23.11, but failure to do it, exacerbated selling pressure at around the $22.00 mark. Consequently, XAG/USD dropped and is forming a two-candlestick bearish pattern, called a ‘bearish-harami’, the equivalent of an ‘inside day.’ A bearish continuation would happen, once Silver price slides below the October 9 swing low of $21.57, putting into play a test of the year-to-date (YTD) low of $19.90.
On the other hand, if XAG/USD recovers the $22.00 figure, buyers must claim a June 23 low of $22.11. A breach of the latter will expose the 20-day Exponential Moving Average (EMA) at $22.38 before testing the 50-day moving average (DMA) at $22.98.
XAG/USD Price Action – Daily chart
XAG/USD Technical Levels