GBPUSD Price Analysis: Volatility contracts amid quiet market mood, 1.1800 a key support
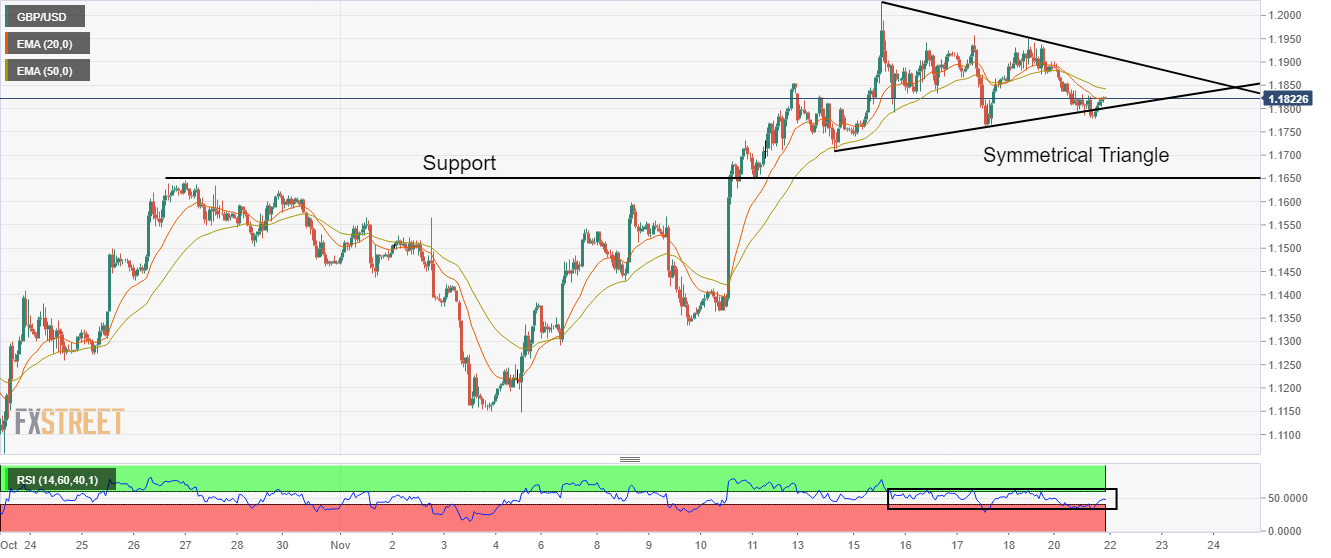
- The formation of a symmetrical triangle indicates a consolidation ahead.
- Overlapping short-to-medium-term EMAs signals a volatility contraction.
- Quiet market mood is keeping the risk-perceived assets in a rangebound structure.
The GBPUSD pair turned sideways in the early Tokyo session after attempting a rebound below the critical support of 1.1800. The Cable is looking to extend its recovery above 1.1820 as risk-perceived currencies are gaining some traction in a quiet market mood.
Meanwhile, the US dollar index (DXY) is hovering around 107.80 after a bullish Monday. Apart from that, the 10-year US Treasury yields also rebounded to near 3.83% despite bleak chances of continuation of the 75 basis points (bps) rate hike structure by the Federal Reserve (Fed).
A formation of a Symmetrical Triangle on an hourly scale is indicating a volatility contraction. The upward-sloping trendline of the chart pattern is placed from November 14 low at 1.1710 while the downward-sloping trendline is plotted from November 15 high at 1.2029. A breakout of the same will result in wider ticks and heavy volume.
The 20-and 50-period Exponential Moving Averages (EMAs) are overlapping with each other, which signals a consolidation ahead.
Meanwhile, the Relative Strength Index (RSI) (14) has shifted into 40.00-60.00, which indicates the unavailability of a fresh trigger for decisive action ahead.
Going forward, a break above Friday’s high at 1.1950 will drive Cable towards November 15 high at 1.2029, followed by the round-level resistance at 1.2100.
On the flip side, a drop below Monday’s low at 1.1780 will drag the asset toward November 14 low at 1.1710. A slippage below November 14 low will expose the asset to the horizontal support plotted from October 27 high at 1.1646.
GBPUSD hourly chart

